Price tells you where a bond trades. Yield tells you what it offers. But to really understand a bond, you often need another layer: how sensitive it is to rate changes, how it compares with benchmark curves, and what its bid/ask yield says about executable market levels.
That layer is now available on TradingView. Registered users can now analyze bonds using professional fixed-income metrics across charts, indicators, and Bond Screener — bringing duration, convexity, DV01, spreads, and Bid/Ask yield closer to the rest of your research workflow.
Switch the chart from price and yield to spreads
On bond charts, you can now switch from price and yield metrics to spread metrics. This makes it easier to see how a bond’s spread changes over time and compare its movement with price and yield behavior.
Instead of looking only at where the bond trades, you can now follow how its relative value changes against benchmark and curve-based references.
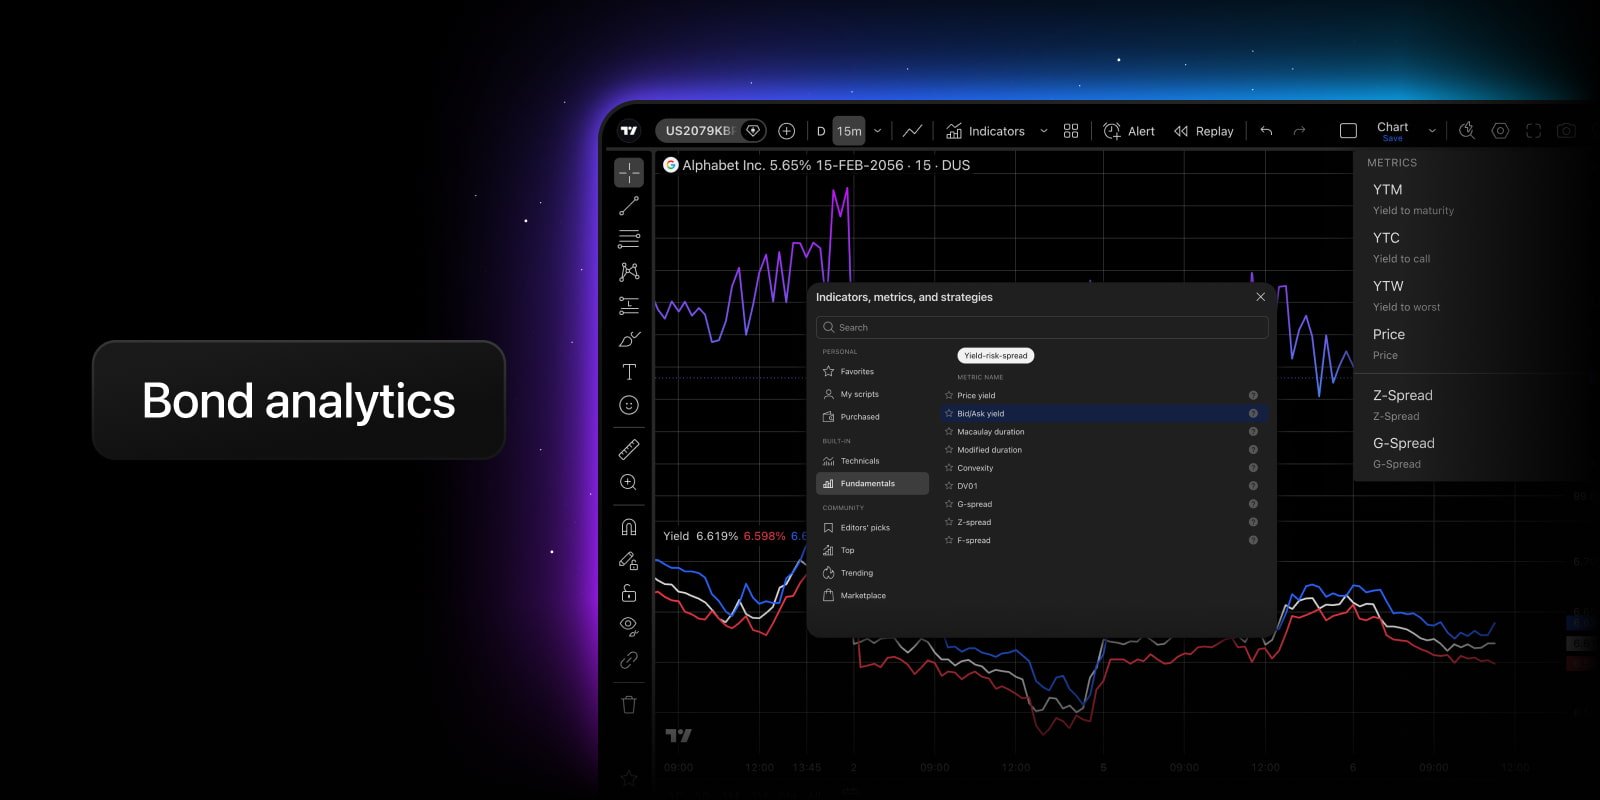
Add bond analytics as chart indicators
Advanced bond metrics are also available as indicators. You can find them in:
Indicators → Fundamentals → Yield-risk-spread
This lets you add risk and spread metrics to the chart and analyze their historical dynamics alongside price action.

Track yield, bid yield, and ask yield
The Yield indicator gives you more control over what kind of yield you want to analyze. In the indicator settings, you can choose the preferred yield type, making it easier to compare close price yield with bid and ask levels directly on the chart.
Screen bonds by risk and spreads
We’ve also added two new Bond Screener tabs, each with its own column set:
- Interest Rate Risk
- Spreads
These views help you screen and compare bonds by the metrics that matter for fixed-income analysis, narrowing the bond universe faster — whether you’re looking for bonds with lower rate sensitivity, comparing spread levels, or identifying securities with specific yield-to-bid or yield-to-ask characteristics.
Why it matters
Bond markets are often analyzed through multiple lenses at once: price, yield, duration, convexity, DV01, and spreads. Each metric answers a different question.
Yield helps estimate return. Duration and DV01 help measure sensitivity to interest rates. Convexity adds more context on how that sensitivity changes. Spreads help compare a bond against benchmark and curve-based references. Bid/Ask yield helps users understand where the market is actually quoted.
Bringing these metrics into TradingView makes bond analysis more connected: charts, indicators, and Screener now work together as part of the same fixed-income workflow. Price shows where the bond is. Advanced analytics help explain what risks and opportunities are behind it.
Let us know what you think — your feedback helps us shape what we build next.
Team TradingView
Source: https://www.tradingview.com/blog/en/bond-risk-yield-and-spreads-61516/