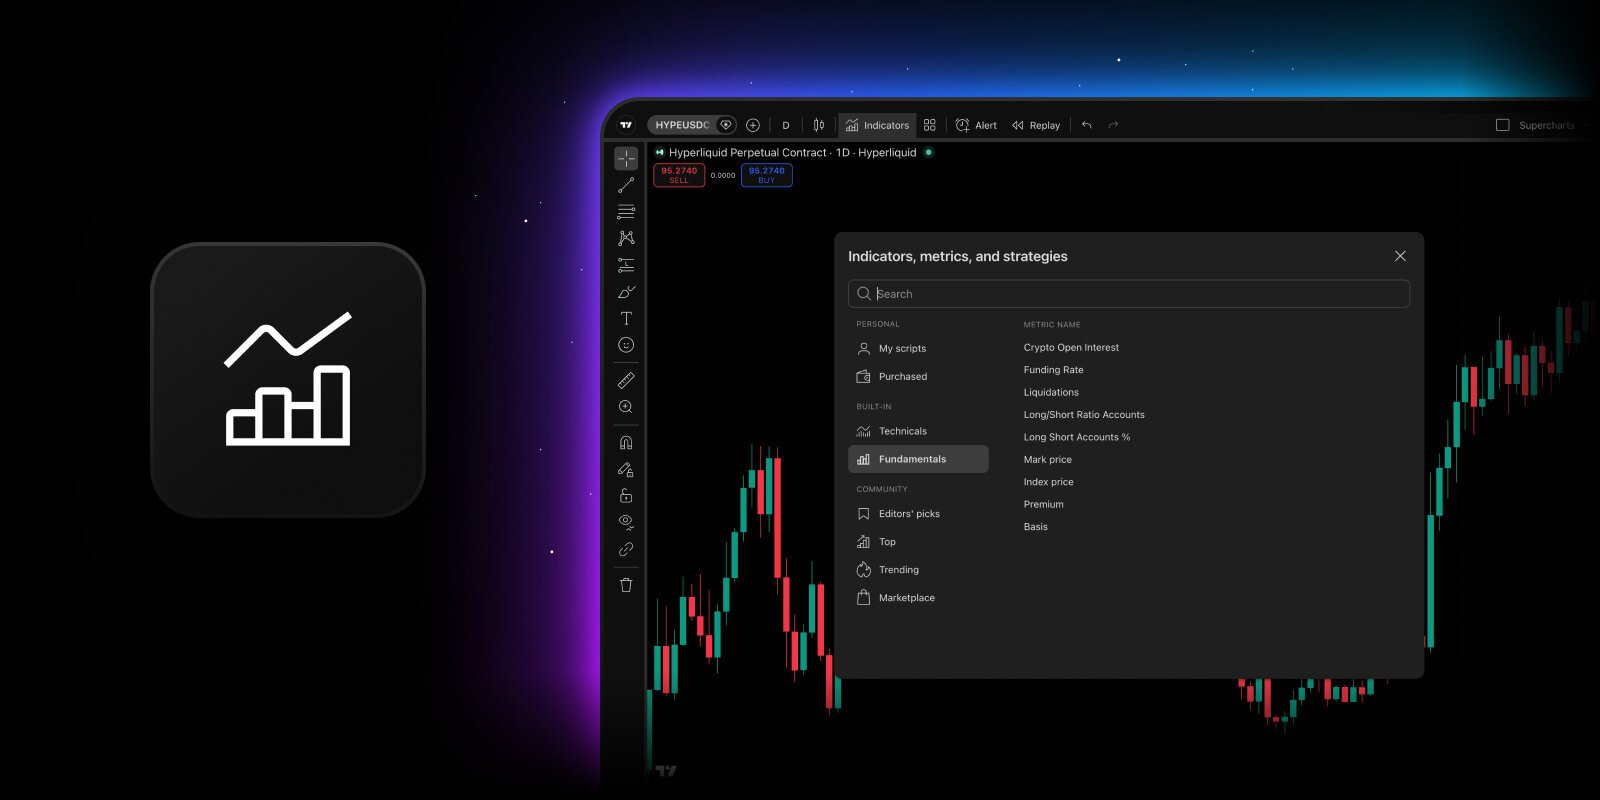
Hyperliquid perpetual futures now feature derivative metrics on TradingView. Until now, this kind of data was only available for centralized exchanges. With this latest update, the largest derivatives DEX, and the first decentralized exchange in our data set, gets them too. Nine indicators — from positioning to liquidations — are available for more than 170 Hyperliquid contracts, as well as for HIP-3 markets launched on its infrastructure — Trade[XYZ] and Paragon — bringing the total to 300+ contracts to explore:
- Crypto open interest
- Funding rate
- Liquidations
- Long short ratio accounts
- Long short accounts %
- Mark price
- Index price
- Premium
- Basis

To add the metrics to your chart, open symbol search, find a perpetual future on Hyperliquid (HYPERLIQUID:), Trade[XYZ] (HIP3XYZ:), or Paragon (HIP3PARA:), and go to Indicators → Fundamentals. Or just search by the indicator’s name. Each indicator also comes with a full description in our knowledge base.
What’s different about Hyperliquid
A major difference between Hyperliquid and familiar venues is that the funding rate is paid out every hour. On most centralized exchanges, the standard interval is eight hours, though it can be shorter for individual contracts.
In addition, the HIP-3 standard lets third-party teams launch their own perpetual futures on Hyperliquid’s infrastructure, and these instrument sets include not just crypto but contracts on stocks, ETFs, commodities, and indices. Metrics for them are calculated the same way as for crypto contracts, so you can view open interest and liquidations, for example, on Brent oil perpetual contract.
Now you can go ahead and open the symbol search and pull up any Hyperliquid, Trade[XYZ], or Paragon perpetual future to read market positioning. Let us know what you think — your feedback drives our updates.
Team TradingView
Source: https://www.tradingview.com/blog/en/derivative-metrics-for-hyperliquid-61060/